...(1992=100):
                 Productivity        Unit Labor Costs
                Q1-R  Q1-P    Q4     Q1-R  Q1-P    Q4
NonFarm          1.0   1.7   2.1      1.8   0.6   8.9
Manufacturing    2.4   2.7   1.9      4.5   2.7   9.8
Durable Goods    2.2   2.7   3.0      6.2   3.8  11.1
NonDurables      1.8   2.0   0.3      2.4   1.6   6.8
Total Business   0.5   1.3   1.5      1.9   0.7   8.8
Nonfin. Corps    N/A   0.6   1.3      N/A   4.1   7.3
 P-Preliminary, PR-Previous reported, R-Revised. N/A-Not
Available.

               Hourly Compensation
               Q1-R   Q1-P    Q4
NonFarm         2.8    2.3  11.2
Manufacturing   6.9    5.5  11.8
Durable Goods   8.5    6.6  14.4
NonDurables     4.3    3.6   7.1
Total Business  2.5    1.9  10.4
Nonfin. Corps   N/A    4.7   8.7
 P-Preliminary, PR-Previous reported, R-Revised. N/A-Not
Available.

 CHANGE IN NON-FARM PRODUCTIVITY FROM SAME QUARTER A YEAR AGO:
                           Q1'07/06 (Prev)
Productivity                   1.0    1.1
Output                         2.0    2.2
Hours                          1.1    1.1
Hourly Compensation            3.2    2.4
Real Hourly Compensation       0.7   UNCH
Unit Labor Costs               2.2    1.3


   FORECAST:
   Reuters survey of economists forecast:
   U.S. Q1 non-farm productivity +1.1 pct
   U.S. Q1 non-farm unit labor costs +1.2 pct

   HISTORICAL COMPARISONS/NOTES:
    U.S. Q4 UNIT LABOR COSTS REVISED TO +8.9 PCT FROM PREVIOUSLY
REPORTED +6.2 PCT


 Test Fiat Panda La Prima: Styl za dobrou cenu a automat k tomu
 Test ojetiny: Možná se vyplatí nejít automaticky pro Škodu. Opel Insignia II je opomíjenou ojetinou za skvělé peníze
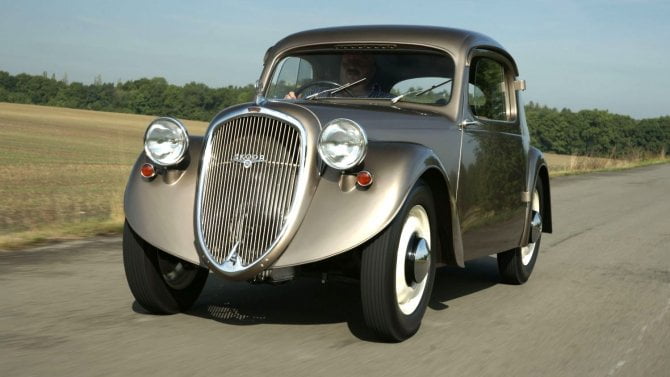
 Tohle měla být Škoda pro chudé. Sagitta představovala zajímavý nápad, ale do série se nedostala
 Na Slovensku nově může člověk dostat pokutu za rychlost, pokud poběží na autobus. Po chodníku se teď musí chodit a jezdit nanejvýš 6 km/h
 Test Volkswagen Caravelle Long 2.0 TDI 4Motion: Mikrobus do nepohody
